I have been working on Laravel from the past 6 years and only used Xdebug a couple of times. This was when I was fairly new to the project I am working on, and I had to dig into the algorithm. Those days I used NetBeans along with simple XAMPP setup for my development.
I have been using
dd and
var_dump to debug the application, so much has been changed in my development environment that I had no idea how to go about on setting up Xdebug on my development environment setup that includes macBook as OS and serving the sites using Laravel Valet and VS Code as the Editor.
I am writing down this article as a reference and also for someone who is stuck on setting up Xdebug.
Let's get started.
1. Install Xdebug
* Before setting up Xdebug, make sure you have PHP installed on your machine using Homebrew.
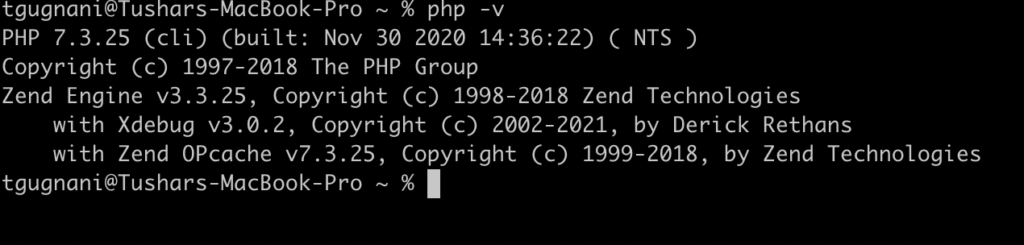
The First step is to install Xdebug on your machine, you can check if you already have xDebug installed in your machine by running the following command.
php -v
The output of this command gives you the current version of PHP installed on your machine. If along with that you also get the Xdebug version, it means that you already have Xdebug installed.
If not, here is how to install Xdebug.
pecl install xdebug
The xDebug installation will automatically insert an entry into your active php.ini file on the top. The php.ini file for my php 7.3 installation is located at
/usr/local/etc/php/7.3/php.ini
This is what should be inserted by xDebug installation.
zend_extension="xdebug.so"
Restart valet by running the following comand; so that the new changes are loaded.
valet restart
Let's move on to the next step.
2. Ensure Xdebug installed
As the next step, let's ensure that we have installed xDebug to the correct php version. If you are runing multiple php versions on your machine there can be a chance where the CLI php version is different from what is running on the browser.
In this step, let's just make sure that the PHP version which is running is the browser actually has Xdebug enabled.
In your Laravel project, open the
index.php file located inside
public folder and add the following line at the top.
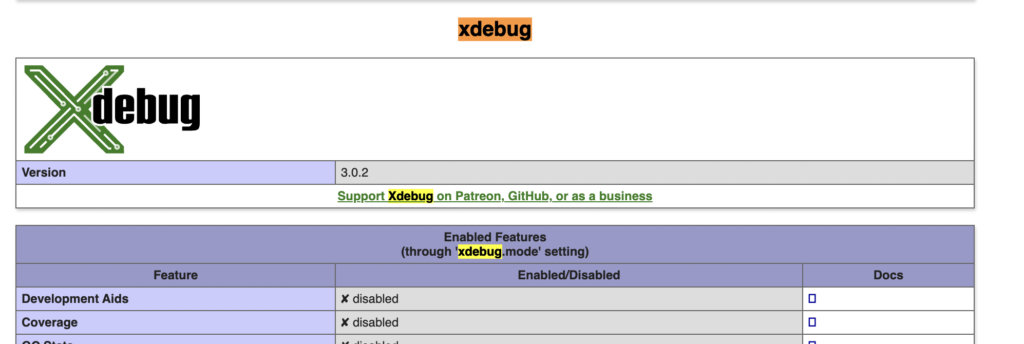
phpinfo();
Open the project in the browser, and you should see all the php configuration in the table format. Search for Xdebug, if you find a dedicated section for Xdebug, it means that it is enabled in your browser php version.
3. Test if Xdebug working
Before we move on to VS Code, we need to make sure that Xdebug is working and opening up the connection at the desired port. Let's quickly make a few changes to test if Xdebug is actually working.
Go to the php.ini file and add the following lines, just below the xdebug.so entry
zend_extension="xdebug.so"
xdebug.mode = debug
xdebug.log = /tmp/xdebug.log
xdebug.client_port = 9003
Install Chrome Extension
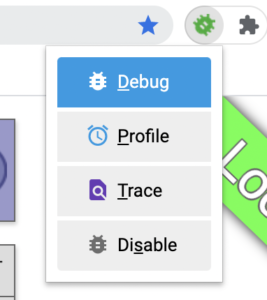
Next up we need to install a Chrome extension https://chrome.google.com/webstore/detail/xdebug-helper/eadndfjplgieldjbigjakmdgkmoaaaoc?hl=en
Open your local web application in the browser and switch on the debugging via chrome extension.
Refresh the page and open the log file located at the path mentioned in php.ini file. I placed mine at
/tmp/xdebug.log , If you see entries in that file, it means that Xdebug is working.
[50403] [Step Debug] INFO: Connecting to configured address/port: localhost:9003.
[50403] [Step Debug] WARN: Creating socket for 'localhost:9003', poll success, but error: Operation now in progress (19).
[50403] [Step Debug] WARN: Creating socket for 'localhost:9003', poll success, but error: Operation now in progress (19).
4. Configure VSCode for Debugging
As the final step, lets configure VSCode to help debug the laravel code.
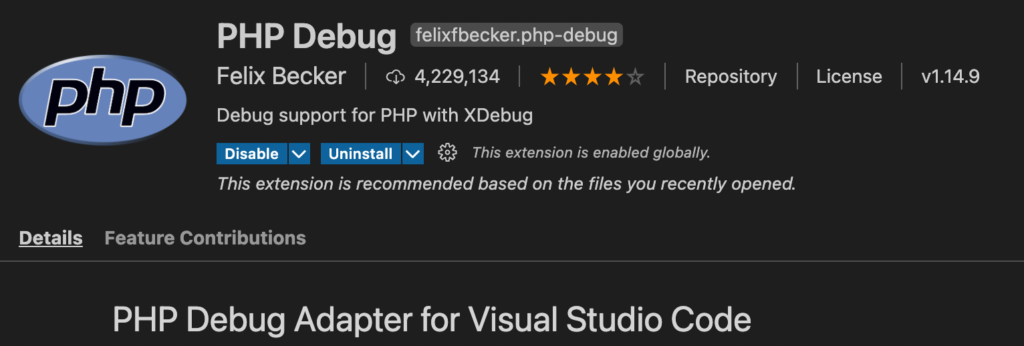
Install PHP Debug Extension
In order to be able to debug php / laravel application via VS Code, you must install an additional extension named PHP Debug. Go to your extension section and search for PHP Debug.
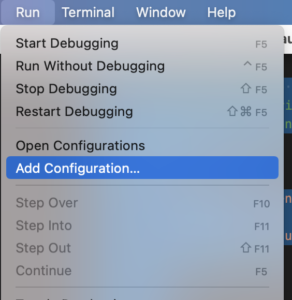
Once PHP Debug extension is installed, It's time to configure the VS Code debugger to listen for debug port. Click on
Run in the top menu item and select
Add Configuration. Select the PHP option from the menu.
Here is how the PHP debug configuration file (launch.json) looks like
{
    // Use IntelliSense to learn about possible attributes.
    // Hover to view descriptions of existing attributes.
    // For more information, visit: https://go.microsoft.com/fwlink/?linkid=830387
    "version": "0.2.0",
    "configurations": [
        {
            "name": "Listen for XDebug",
            "type": "php",
            "request": "launch",
            "port": 9003
        },
        {
            "name": "Launch currently open script",
            "type": "php",
            "request": "launch",
            "program": "${file}",
            "cwd": "${fileDirname}",
            "port": 9003
        }
    ]
}
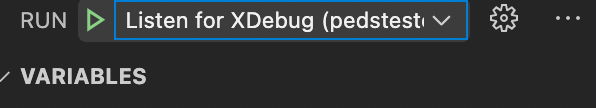
Once you have the configuration ready, you can move on to the debug tab and run the '
Listen for Xdebug' configuration
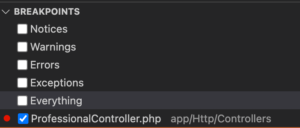
Next up, Place the breakpoint at desired line of code and you should see that VS Code is responding by stopping at giving out details of the current code point.
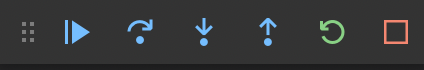
You can now navigate the code at stoppoint with help of debug navigator.
That's all about configuring Xdebug for Laravel Valet and using VS Code Editor.