There are quite a lot of posts online that guides on how to install Xdebug and then configure it with your PHP Editor. I found many of the tutorials confusing and was not able to accomplish the task with them.
I was able to configure xDebug on my OSX (Yosemite) with XAMPP Stack and Eclipse as the Editor with the following steps.
Since xDebug is an PHP Extension. Many other tutorial guides you to download the XDebug and then compile and include it in php.ini file.
** First of all check if you already have XDebug package complied in your system. As it already comes with XAMPP or other stack package, chances are that you already have it available with you.
In XAMPP you should have the compiled xDebug code at following location
/Applications/XAMPP/xamppfiles/lib/php/extensions/no-debug-non-zts-20131226/xdebug.so
** Please note that the actual file name will be different in your machine.
Configure PHP to Use XDebug
1.
Edit php.ini file
Open your php.ini for editing which should be located at /Applications/XAMPP/xamppfiles/etc/ in OSX. Add the following lines at the end of php.ini
[xdebug]
zend_extension="/Applications/XAMPP/xamppfiles/lib/php/extensions/no-debug-non-zts-20131226/xdebug.so"
xdebug.remote_enable=1
xdebug.remote_handler="dbgp"
xdebug.idekey=ECLIPSE_DBGP
Dont forget to change your Xdebug.so file name accordingly.
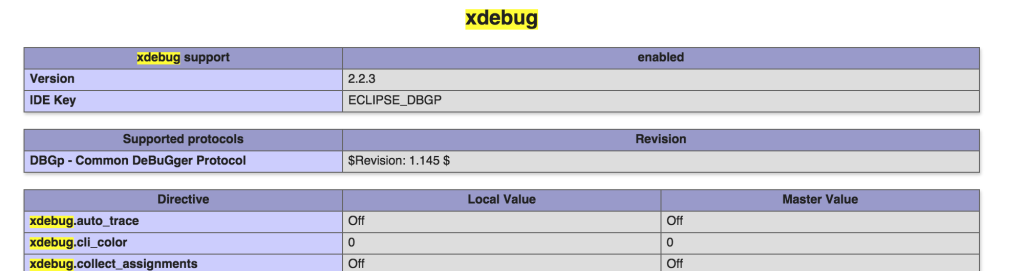
2. Restart your apache server and run
phpinfo(); , you should see a xdebug section in there like below.
 Configuring XDebug in Eclipse
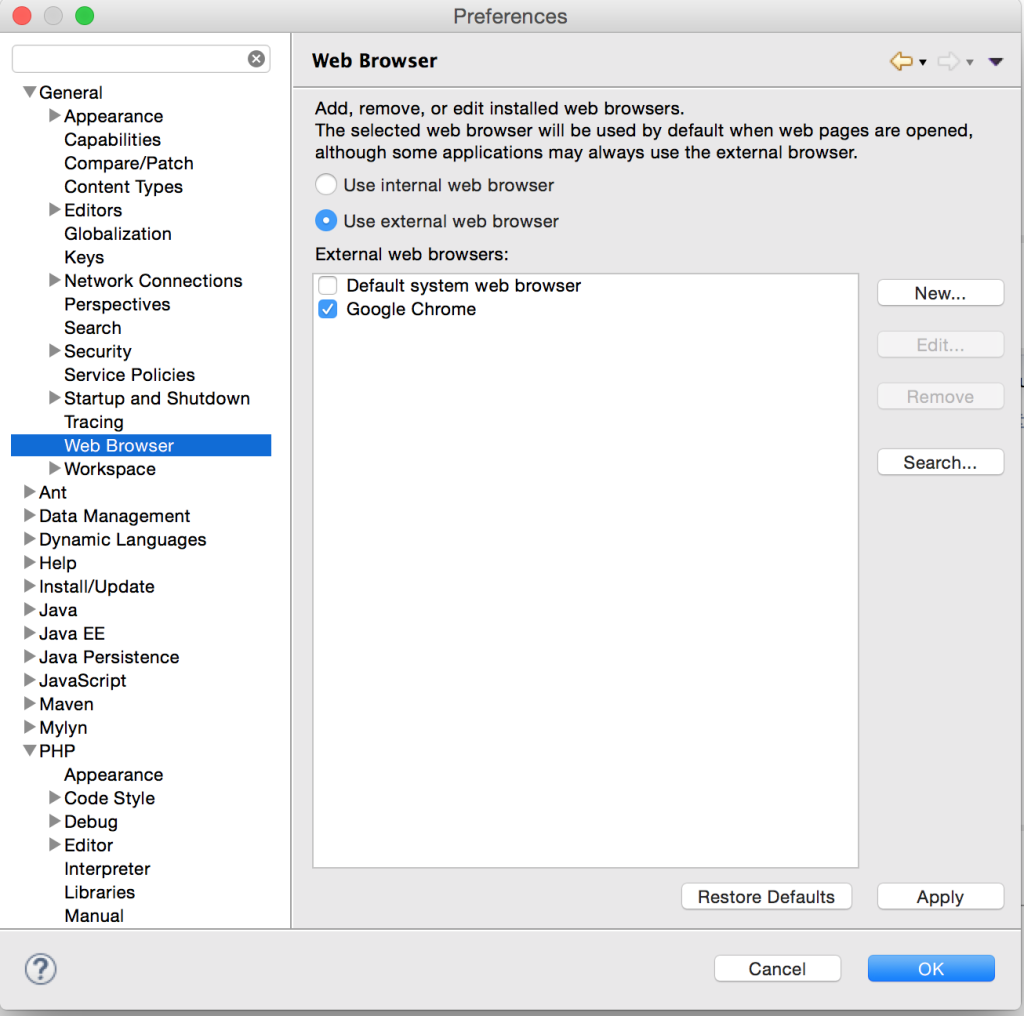
3. Open the 'preferences' settings in your eclipse and go to General -> Web Browser. Choose your default web browser. We are doing this so that eclipse opens your application in your browser as opposed to its internal browser when it starts debugging.
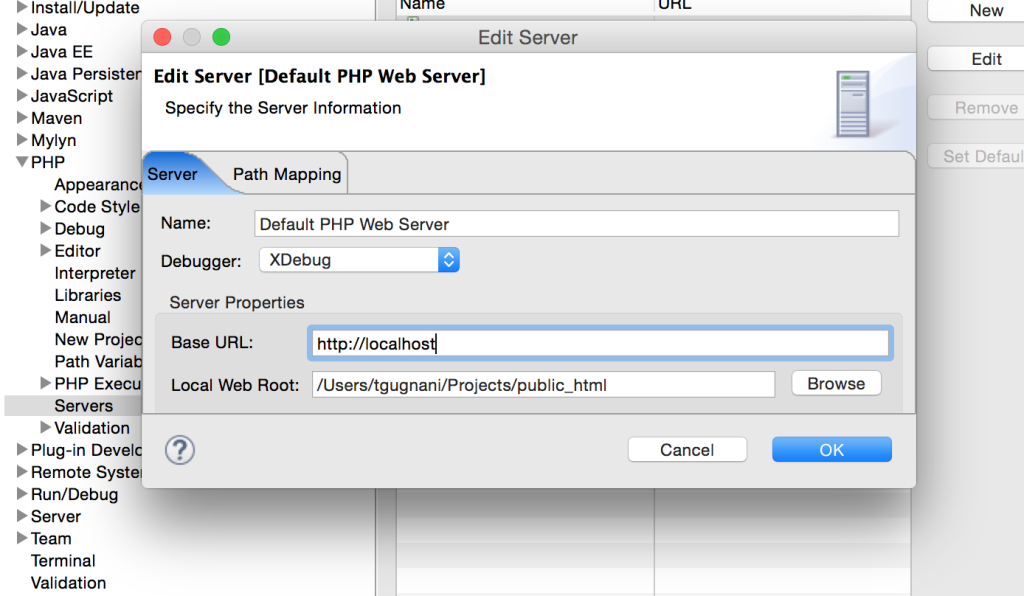
4. Go to preferences PHP-> Servers. You should find your default web server listed there. Click on Edit and choose XDebug as the Debugger. Make sure you have the right Base URL and Local web root entries there.
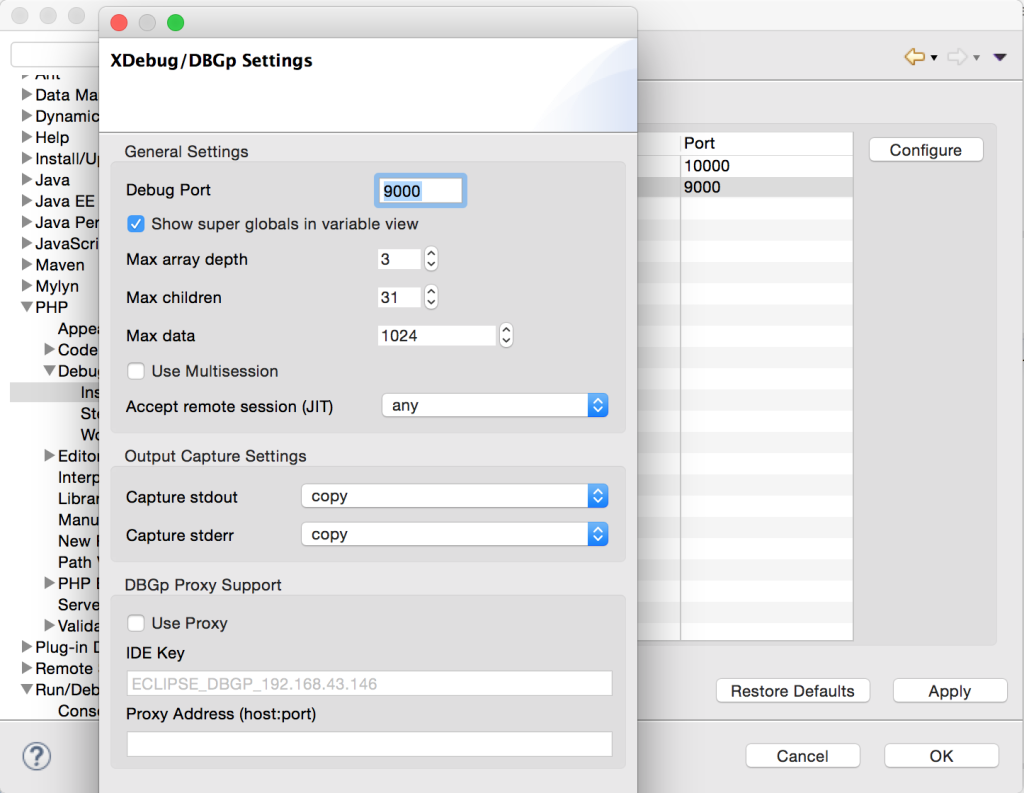
5. In the preferences centre itself go to PHP->Debug->Installed Dubuggers. You should find Xdebug there with port 9000. Click on configure, make sure Accept remote Session (JIT) is set to 'any'
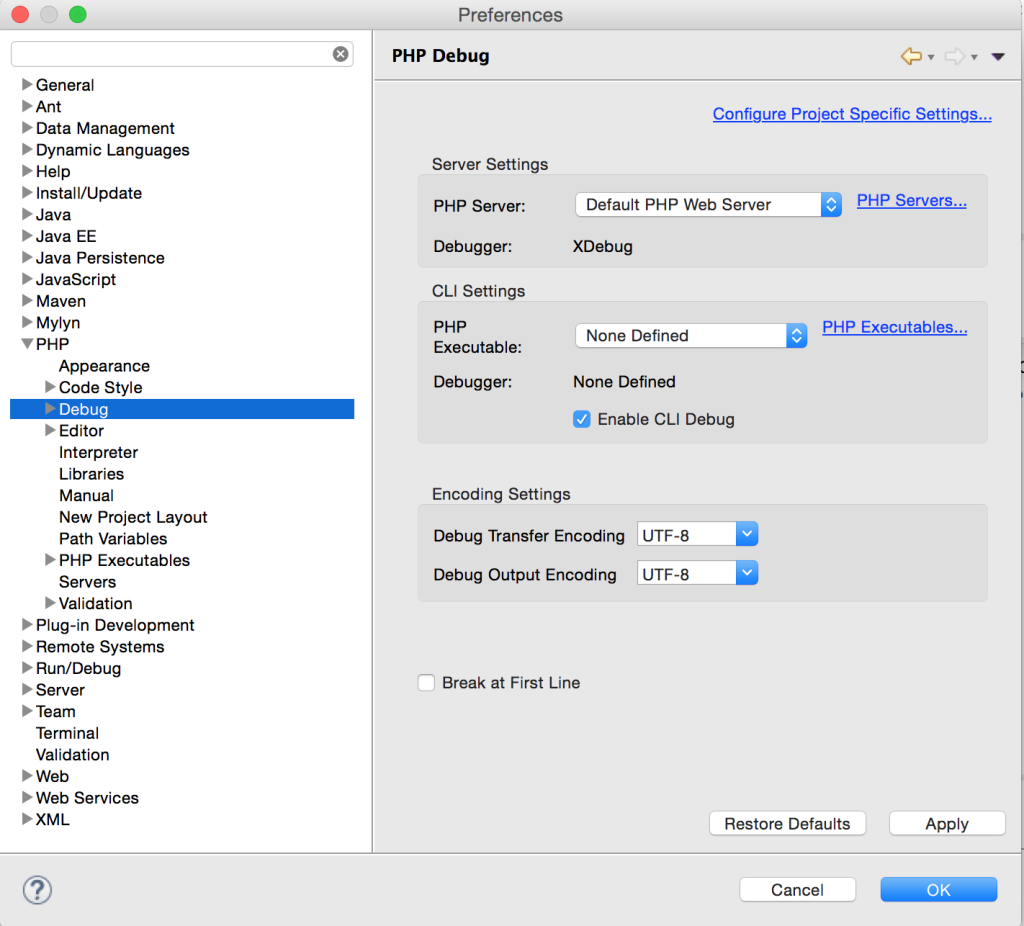
6. In preferences go to PHP-> Debug. And make sure you have XDebug as the debugger and your PHP Server pointing to correct server and URL.
7. Now we are all set to debug our PHP application. Right click on your project and choose Debug As -> Debug Configuration. Create a new debug configuration that we will be using from next time subsequently.
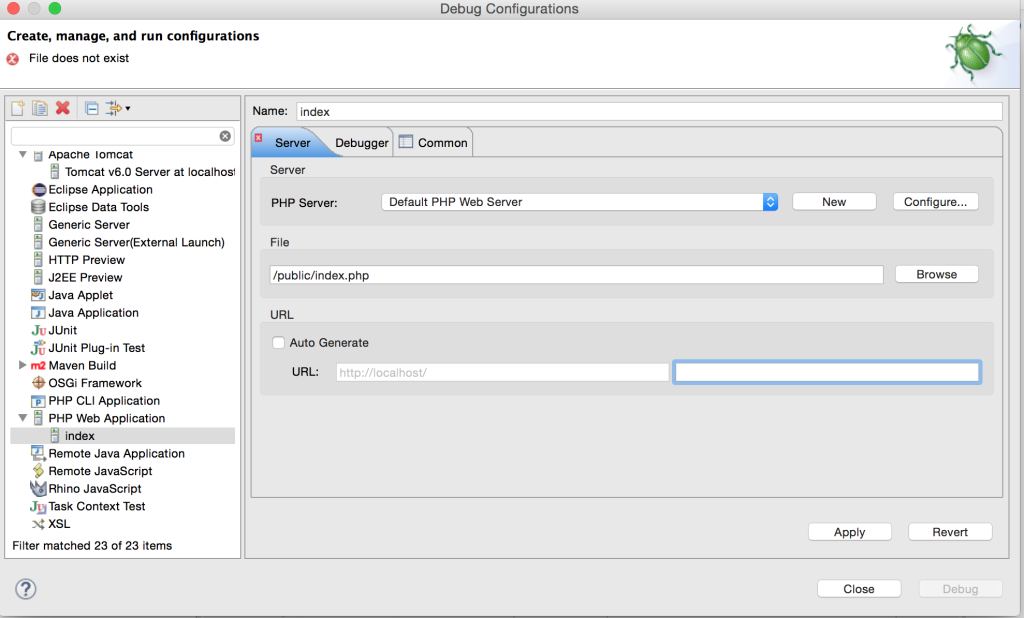
Choose the correct start URL and your default URL, Click on Debug, Eclipse will prompt you to allow opening the debug perspective.
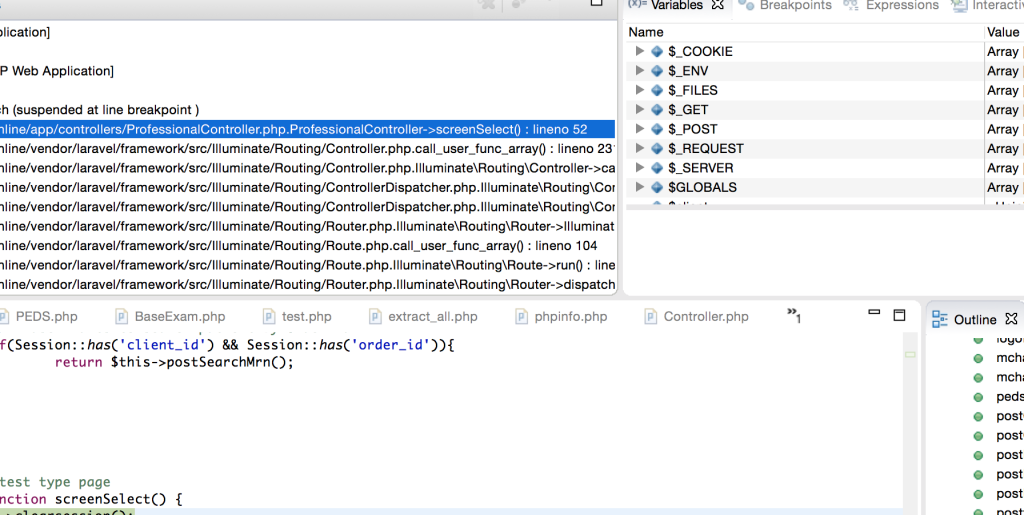
You should now be able to set the breakpoints and watch the variable values and do all sort of obvious debugging things in this perspective.
Happy Debugging. !!
 Configuring XDebug in Eclipse
3. Open the 'preferences' settings in your eclipse and go to General -> Web Browser. Choose your default web browser. We are doing this so that eclipse opens your application in your browser as opposed to its internal browser when it starts debugging.
Configuring XDebug in Eclipse
3. Open the 'preferences' settings in your eclipse and go to General -> Web Browser. Choose your default web browser. We are doing this so that eclipse opens your application in your browser as opposed to its internal browser when it starts debugging.
 4. Go to preferences PHP-> Servers. You should find your default web server listed there. Click on Edit and choose XDebug as the Debugger. Make sure you have the right Base URL and Local web root entries there.
 5. In the preferences centre itself go to PHP->Debug->Installed Dubuggers. You should find Xdebug there with port 9000. Click on configure, make sure Accept remote Session (JIT) is set to 'any'
 6. In preferences go to PHP-> Debug. And make sure you have XDebug as the debugger and your PHP Server pointing to correct server and URL.
 7. Now we are all set to debug our PHP application. Right click on your project and choose Debug As -> Debug Configuration. Create a new debug configuration that we will be using from next time subsequently.
 Choose the correct start URL and your default URL, Click on Debug, Eclipse will prompt you to allow opening the debug perspective.
 You should now be able to set the breakpoints and watch the variable values and do all sort of obvious debugging things in this perspective.
Happy Debugging. !!
You should now be able to set the breakpoints and watch the variable values and do all sort of obvious debugging things in this perspective.
Happy Debugging. !!